Which Salinity Data are Best for You?

RSS

The "land correction" that we apply is more of a far sidelobe correction. It takes out the effects of the far antenna sidelobes. However, this method breaks down if there is land contamination in the main antenna lobe.

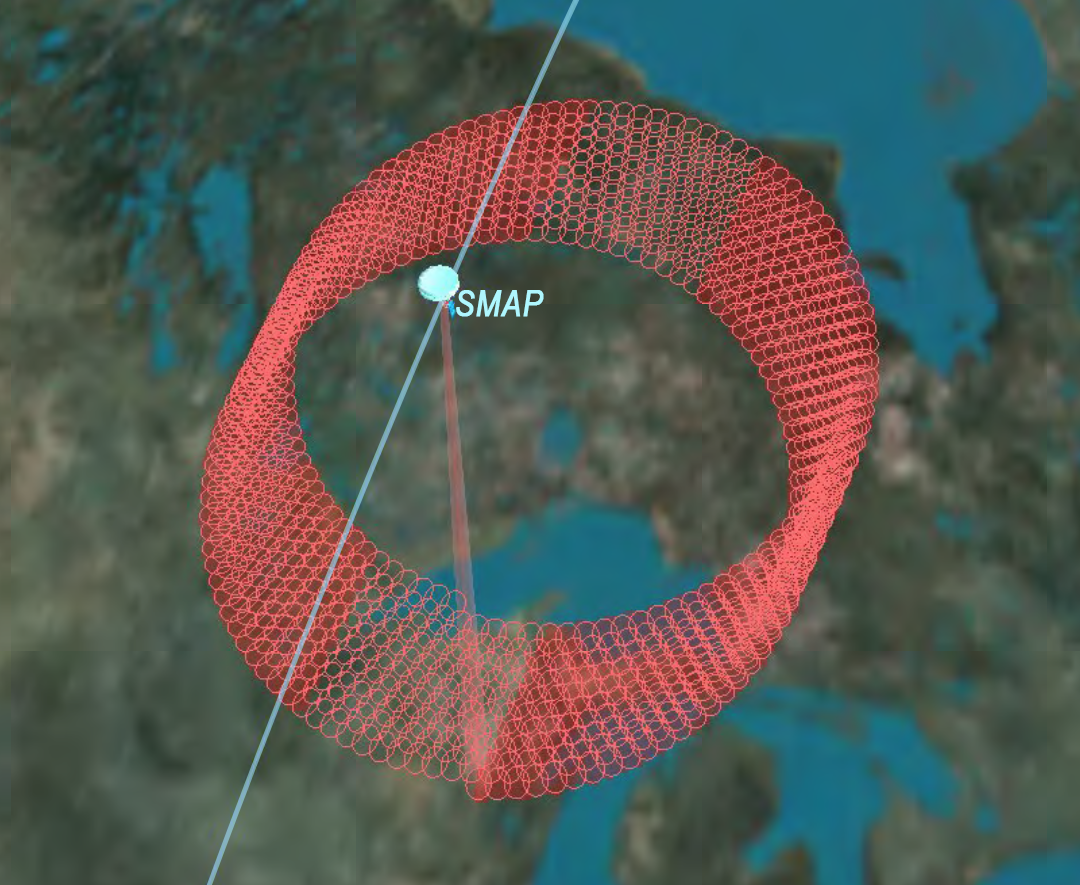
Where is the main antenna lobe? Its diameter is 2.5 times the 3dB footprint diameter. The 3dB footprint diameter is where the power has fallen by half, which for SMAP is at about 40 km (~25 mi). As a result, the RSS "land correction" works up to about 40 km from the coast.

The correction is based on a pre-computed table based on this methodology:
  • Run an on-orbit simulator
  • At a given location in the ocean near the coast, compute the difference in brightness temperatures (ΔTB) derived from:
    • Antenna temperature within the 3dB footprint of the main lobe (TB3dB)
    • Measured antenna temperature obtained by integrating over the SMAP antenna gain pattern (i.e., gain-weighted average) including the sidelobes that fall over land (TBmea)
  • The difference is tabulated as a function of longitude, latitude, part of the orbit (ascending or descending), look azimuth of the SMAP antenna, and time (i.e., monthly climatology)
  • Resolution of the table is 1/8° (12.5 km or ~8 mi) for longitude and latitude
  • When running the algorithm, we interpolate from this pre-computed table
Where:
  • ΔTB - far sidelobe correction
  • TB3dB - footprint-averaged TB from on-orbit simulator
  • TBmea - measured from on-orbit simulator
SMAP in orbit
Video animating how the SMAP spacecraft operates in Earth's orbit. (Source: NASA Jet Propulsion Laboratory)
SMAP radiometer 3-dB instantaneous field-of-view footprints
SMAP radiometer 3-dB instantaneous field-of-view footprints (red ellipses) mapped out by the helical scan pattern. For display clarity, only every third footprint along the scan is shown. For the nominal SMAP orbit altitude and antenna rotation rate the maximum distance between footprint centers along the groundtrack is approximately 28 km (~17 mi). (Source: Algorithm Theoretical Basis Document Level 1C Radiometer Data Product)
RSS SMAP sea surface salinity map

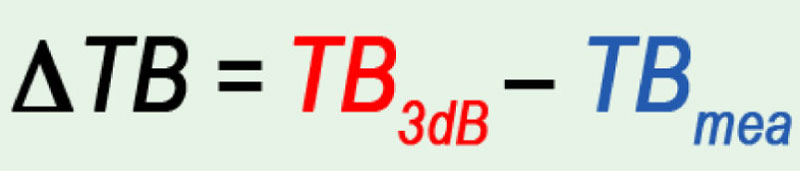
The Level-3 (i.e., gridded) example includes northern Russia and part of the Arctic Ocean averaged over about 8 days. In the 40-km product, you see the data in most places. This is because we don't screen out data close to land in the gridded 40-km product. We do apply some very basic Q/C – which means we throw out sun glint, sun glitter, very high galaxy, very high winds – so there is some limited Q/C in the Level-3 files. For example, in this particular 40-km product, you see contamination from land and sea ice.

Note, however, that our Level-2 (swath) 40-km product basically includes all the data without doing any screening; however, Q/C information is available in the data files, which users can apply themselves if they want data close to the coast.

We consider the 70-km product as "science grade" (i.e., for scientific publications). To produce 70-km gridded data, we go back to the 40-km product. We apply Q/C checks based on our very extensive analysis of the degradation caused by various factors, including land and sea ice. We screen out those data and then do a simple smoothing after we have taken them out. This results in the loss of the some of the data. This can be seen in the pink "land and sea ice mask."

RSS Land-contamination Quality Control (Q/C) Flags (view all)
Q2 - If the conditions for strong land contamination are met (gland > 0.1 or fland > 0.1), we do NOT retrieve salinity at all. Otherwise, we retrieve salinity (at 40-km) and record it in the Level-2C 40-km product. When smoothing to 70-km, we apply Q/C checks and include only grid cells in the next-neighbor average that pass the Q/C.
Q8 – We do not include 40-km observations in the 70-km average that fall under the category moderate land contamination (gland > 0.04 or fland > 0.005). Also, we do NOT produce a 70-km value if the center cell has moderate land contamination, even if some of the surrounding cells would pass. This is because we do not want to record a value in a cell that has no actual observation at the center location.
Q13 - The thresholds for light land contamination (gland > 0.001) indicate the limits at which the TB land correction becomes sizeable. Observations with smaller land contaminations can be regarded as "open ocean."
NOTE: Level-3 follows the same methodology. The only small difference is that we also include some very basic Q/C at 40-km (e.g., very high galaxy, sun glint, very high wind), but still no Q/C for land contamination.