

The major change in Version 4 (V4) from Version 3 (V3) is an improved land correction, which extends the SMAP salinity retrievals closer to the coast. Other changes include revised sun-glint flagging, revised sea-ice mask and flagging, inclusion of a spatial resolution and spatial response function, and provision of an empirical uncertainty estimate in the smoothed salinity product Level 3 files. The standard product of the SMAP V4 release is the smoothed product with a spatial resolution of approximately 70 km.
The land tables in V4.0 are derived at 1/8° resolution. In V3.0 the spatial resolution of the land tables resolution had been ½°. The land surface brightness temperature (TB) that is used in the derivation of the land tables in V4.0 is based on a monthly climatology of SMAP land TB measurements. In V3.0 the land surface TB was based on a land surface emission model.
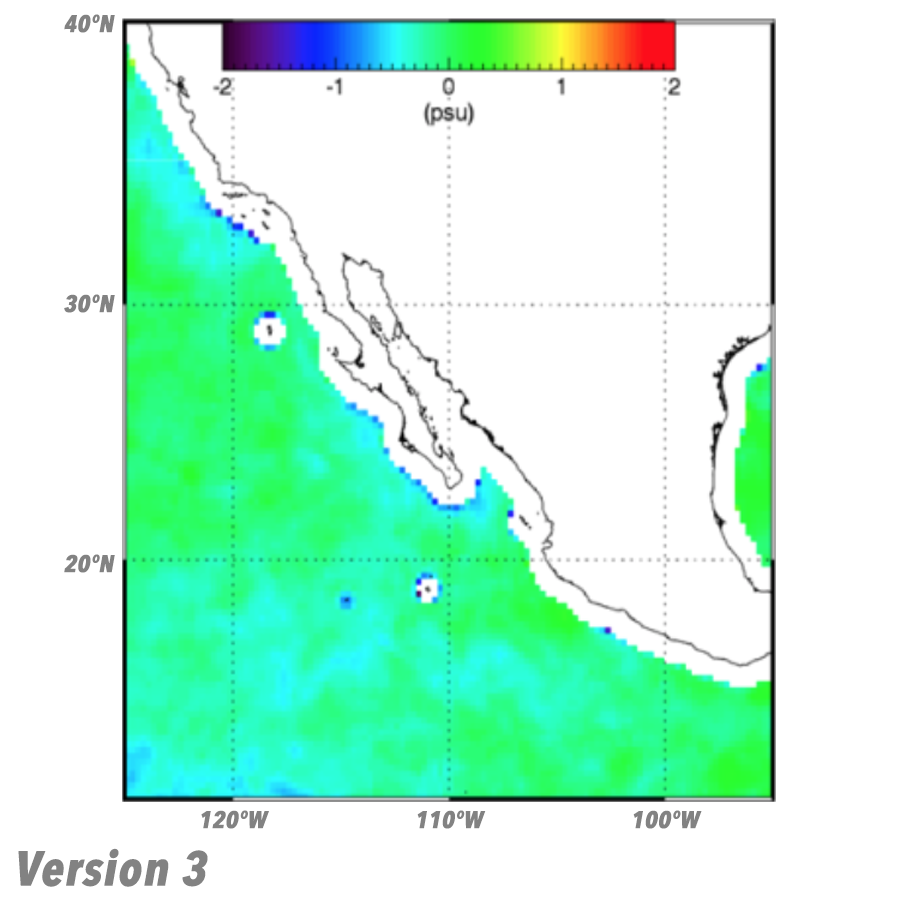
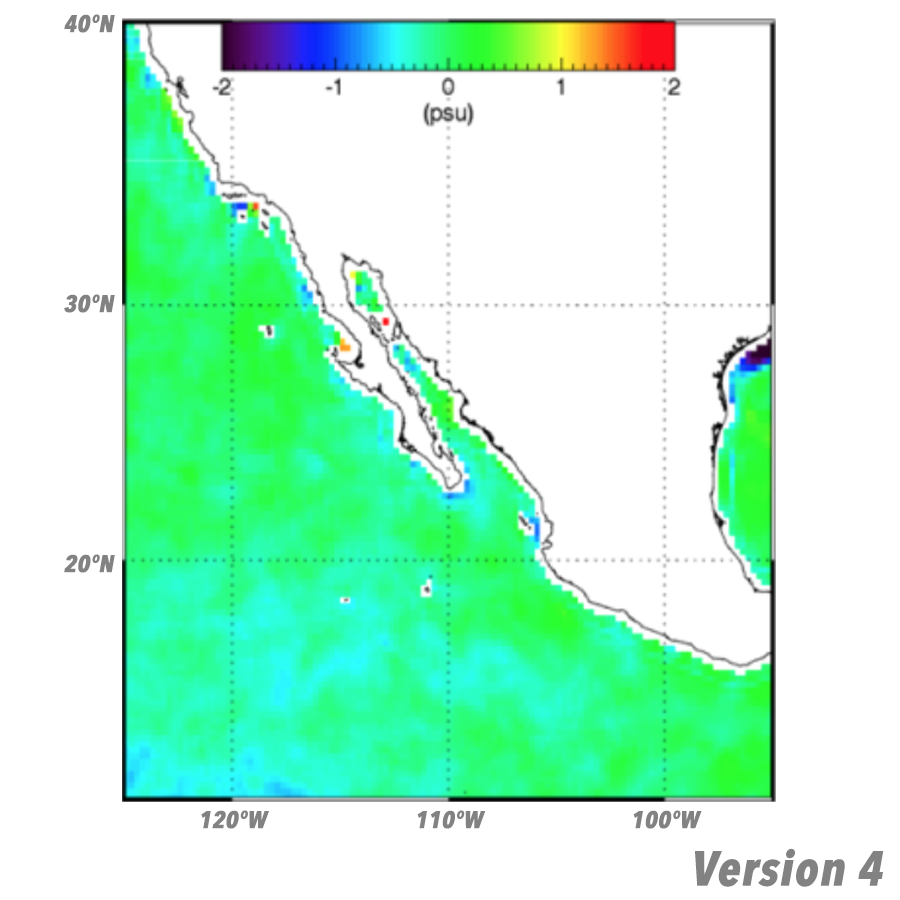
Figure 1 shows monthly maps (05/2018) of SMAP – HYCOM SSS near the Baja of California for the V3.0 and V4.0 70-km/smoothed products. In V3.0 areas within more than 100-km from the coast were flagged to avoid land contamination. Nevertheless, light land contamination is still visible near some coastal areas. In V4.0 SSS can be retrieved within 30 – 40 km from land. Use the slider to compare products.
The sun-glint flag has been revised. In V4.0 the sun-glint exclusion is based on sun-glint angle and surface wind speed. The V4.0 sun-glint flag excludes less data then the V3.0 flag did.
The sea-ice mask in V4.0 is taken from the Remote Sensing Systems (RSS) AMSR-2 sea-ice maps. In V3.0 the sea-ice mask was from National Centers for Environmental Prediction (NCEP). The threshold for sea-ice exclusion in V4.0 has been changed to gice >0.003. This threshold was gice >0.001 in V3.0.
For the NASA/RSS Aquarius salinity retrieval up to V4 and the RSS SMAP salinity retrieval up to and including V3, the daily sea-ice mask from NCEP was used as ancillary field. Brucker et al. (2014) and Dinnat and Brucker (2016) found that the NCEP sea-ice mask is unrealistic in several instances. Consequently, for the Aquarius Version 5 end of mission release, a sea-ice mask from Special Sensor Microwave Imager (SSMI) and Advanced Microwave Scanning Radiometer aboard EOS (AMSR-2) was implemented instead of the NCEP sea-ice mask.
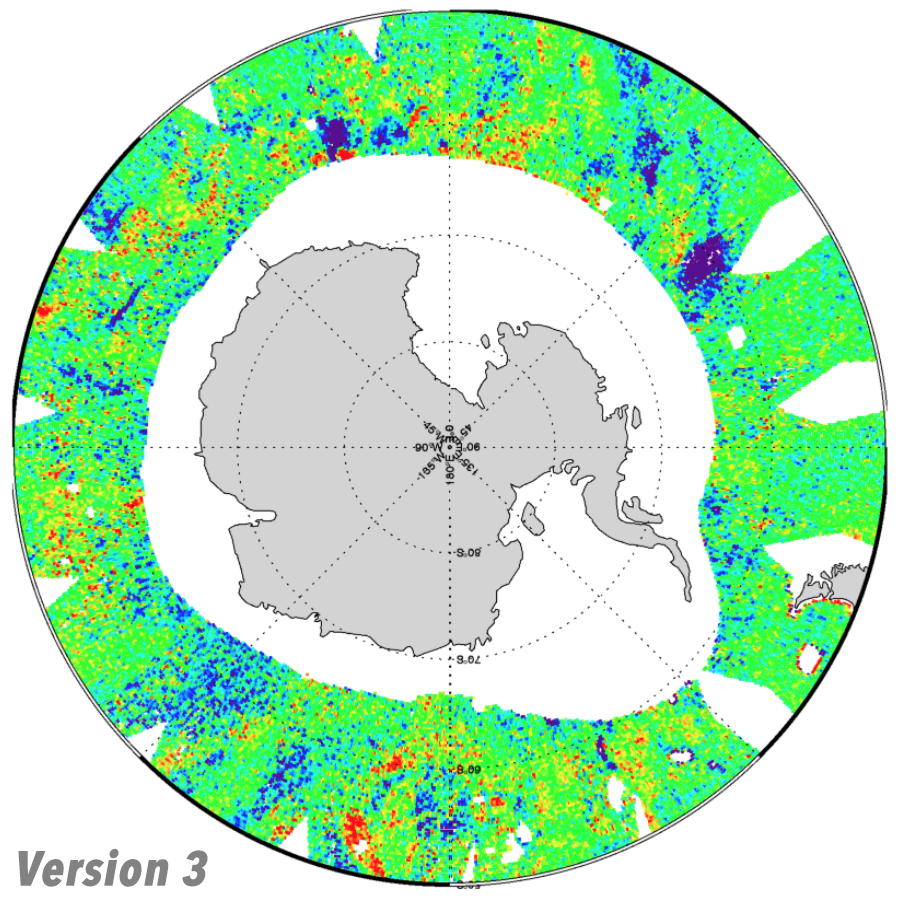
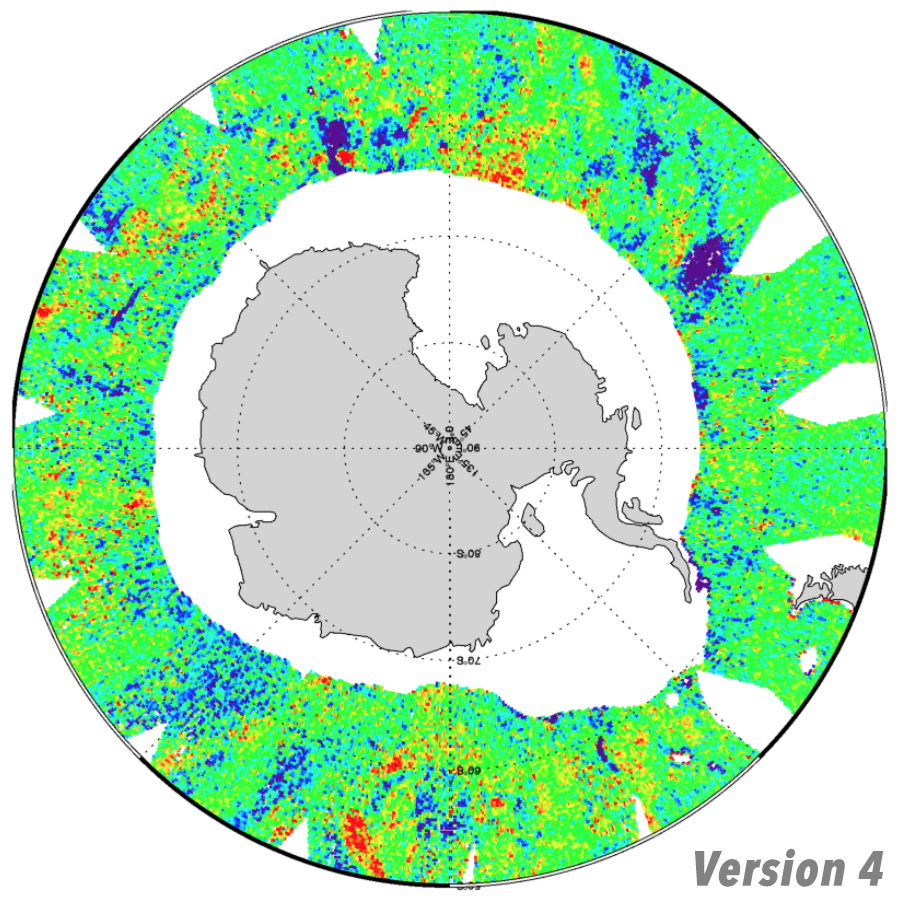
For the SMAP Version 4 release, we have switched from NCEP to the sea-ice mask of the RSS Version 8 AMSR-2 ocean suite, which is produced as part of the daily files (Wentz et al. 2014). We also have increased the threshold for the antenna gain weighted sea-ice fraction gice that is used in the L3 processing from 0.001 (V3) to 0.003 (V4). This increases the coverage in the polar region near the sea-ice edge (Figure 2).
The V4.0 salinity retrieval algorithm is run solely on the 0.25° Earth grid using the 40-km spatial resolution Backus Gilbert Optimum Interpolation (OI). The resulting salinity product is called sss_smap_40km. From this 40-km product, a smoothed product with a spatial resolution of approximately 70km (called sss_smap) is derived using simple next-neighbor averaging. This smoothed 70-km sss_smap is to be regarded as the default (standard) salinity product. In V4, both sss_smap and sss_smap_40km are provided in the same file.
An empirical uncertainty estimate sss_smap_uncertainty is provided for sss_smap in the Level 3 files. This uncertainty is based on comparisons between SMAP and the Scripps Argo interpolated fields. This also includes the sampling error of the Argo data on the scales of the gridded maps, as well as the mapping errors.
Dinnat, E. and Brucker, L. (2016). Improved Sea Ice Fraction Characterization for L-Band Observations by the Aquarius Radiometers, IEEE Transactions on Geoscience and Remote Sensing, doi: 10.1109/TGRS.2016.2622011.
Meissner, T., Wentz, F.J., and Le Vine, D.M. (2017). Aquarius Salinity Retrieval Algorithm Theoretical Basis Document (ATBD), End of Mission Version; RSS Technical Report 120117; 1 December 1 2017. Available online.
Meissner, T., Wentz, F.J., and Le Vine, D.M. (2018). The Salinity Retrieval Algorithms for the NASA Aquarius Version 5 and SMAP Version 3 Releases, Remote Sensing 10, 1121, doi: 10.3390/rs10071121.
Wentz et al. (2014). Remote Sensing Systems GCOM-W1 AMSR2 Daily Environmental Suite on 0.25 Deg Grid, Version 8. Available online.
