Learn More

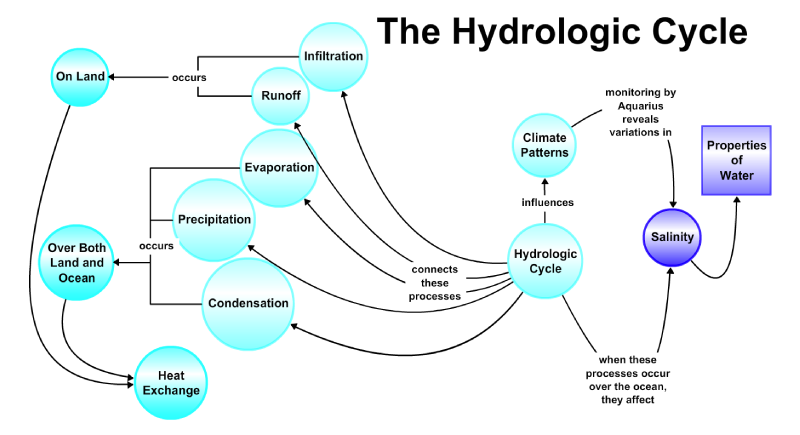
Concept map: the hydrologic cycle
View this interactive map and associated assets in the COSEE-OS concept map viewer.
Concept Map: Hydrologic Cycle
Source: COSEE-Ocean Systems
[12-Aug-2013] This interactive concept map shows how the water cycle is connected to Earth processes such as precipitation and evaporation and how these processes can affect global climate. The map also highlights ties between the Aquarius satellite instrument, salinity, and climate.

View: Click on the image to enlarge. Click on the Escape key or anywhere outside the shadowbox to close.

Download: To download a copy, right click on the image and select Save Image As (on a Mac keyboard, click the touchpad while holding down the Control key). To download the highest resolution in our database, first click on the image to enlarge and then save that version.